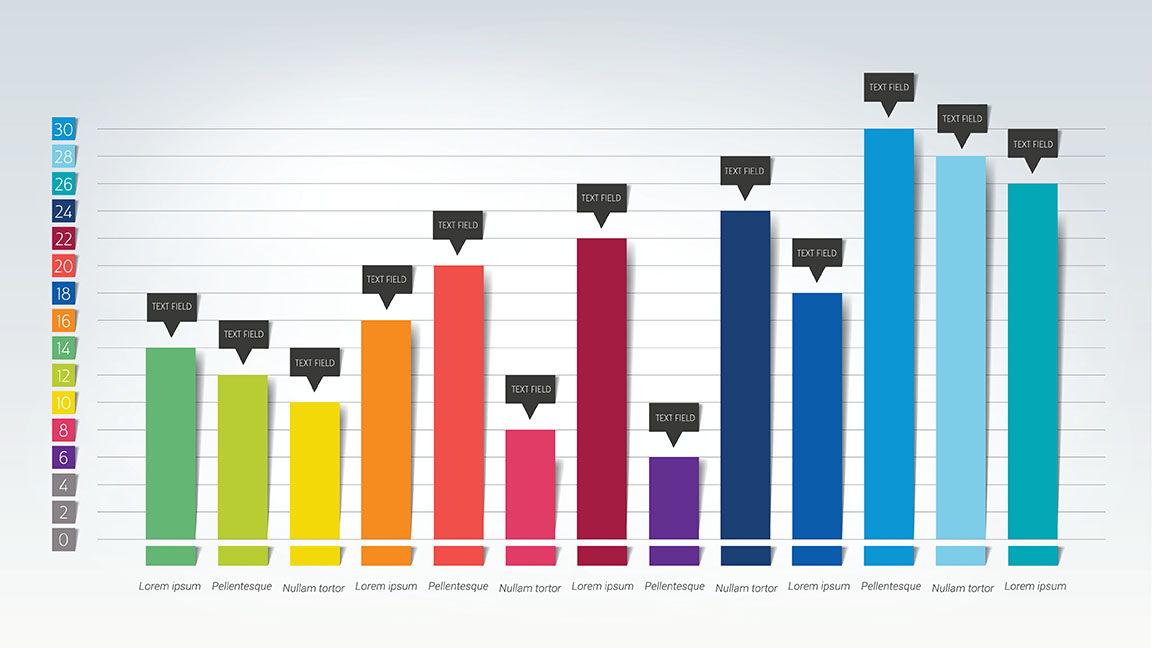

A bar chart is a type of graph that uses bars to represent data. The bars are usually vertical, but they can also be horizontal. The height or length of each bar represents the value of the data that it represents.
Bar charts are often used to compare different values or to show how something changes over time. For example, a bar chart could be used to compare the number of students in different classes or to show how the temperature changes throughout the day.
The bar chart compared the sales of different products.

Noun:
bar chart (a chart that uses bars to represent data).
Adjective:
bar chart (of or relating to a bar chart).
Verb:
bar chart (to create or display a bar chart).
The word "bar chart" is a compound word that comes from the words "bar" and "chart".
The word "bar" comes from the Old English word "bar", which means "a long, solid piece of wood or metal". The word "chart" comes from the Latin word "charta", which means "paper".
What data is useful to show using a bar chart?